LookFar Ventures19 August 2016
Demystifying Startup Finance Part II: KPIs and Benchmarking
Welcome to Part II of our series on startup finance!
This is Part 2 in our Demystifying Startup Finance series. Follow the links to read part 1, part 3, part 4, and part 5.
This week we’ll be talking about a crucial skill for startup founders: understanding and identifying Key Performance Indicators (KPIs). KPIs are best thought of as a variety of metrics that indicate a company’s progress. Utilizing them intelligently can make all the difference between crafting a data-driven, fundamentally sound growth strategy and shooting in the dark.
You can probably guess which of the two approaches is more likely to lead to success.
So, let’s take some time to walk through a few different KPIs, how to measure them, and what insight they can give you as to how your business functions and can improve. Also, we’ll be going through some fairly jargon-heavy turf here – if you’re running into some new words and terms, take a look at the handy finance glossary we published as Part I of this series.
Let’s go!

The Tao of Growth
Paul Graham—founder of the well-known Silicon Valley accelerator, Y Combinator—outlines the most important metric for startups to track in one word: “growth”.
All companies that go through YC are held to the standard of 5-7% weekly growth. How exactly that metric is measured is up to the founders and is typically based on the company. Revenue or user base are two common focuses for companies in the accelerator.
The focus on growth allows founders to make decisions that all build toward a single goal. Onefounder even reported keeping a frequently-referenced sign around that read, “Will this drive 7%+ growth in revenue this week?”
This single-minded focus is tremendously helpful to growth stage founders; however, in the long-term, founders should keep their fingers on the pulse of multiple metrics to ensure they best understand their users, the relative health of their company over time, and how their company compares to competitors. It is important for founders to understand and track their KPIs to make well informed decisions and remain prepared for investors. Collection and comparison of KPIs over time for use in analyzing marginal business success or failure is called benchmarking. This is especially important for startups. Through benchmarking, founders can test their strategies and ensure they are hitting goals.
KPIs and their prioritization differ based on business and revenue model, but several primary categories are important for a majority of young companies. Most companies measure these month-over-month to ensure the most up to date and accurate data. When more data is available it is helpful to examine KPIs both month-over-month and year-over-year to examine larger trends.
Let’s examine major performance metrics for SaaS subscription models:
Churn
Churn: rate at which users discontinue use of a product. Churn can be calculated using this formula:

Churn is a vital KPI on its own, but it also plays a crucial role in calculating other metrics, therefore allowing for better understanding of financial planning.
Churn can also be used as a rough measure of user engagement as it tracks user reaction to change in features. This understanding of user preference allows founders to create a product with better product/market fit. If a change is made and churn increases shortly thereafter, it is safe to assume the change was not welcomed by users. On the other hand, if that change is made and churn decreases, it can be assumed the change increased the perceived value for users or brought the product closer to product/market fit.
Revenue churn: the amount of recurring revenue changed in a period (typically a month), accounting for increase in revenue from first time users and users who have upgraded their service to a higher subscription rate if offered by the company.

User churn: the amount of change in number of users for a company in a period (typically a month).

**Customers lost can be cancellations or lack of renewal of services.
The relationship between revenue and user churn is important for companies following a price-tiered subscription model. If a company loses more low end users than high end users, the impact on revenue will be significantly less than it would be if the situation were reversed.
Rule of thumb: Replacing churned consumers (and therefore the revenue they generate) becomes increasingly difficult as a company scales. For this reason, churn doesn’t have many rules that hold over time. Young companies will always see some churn, which can actually benefit the company by informing decision makers about user preference; however churn should shrink as the company grows and finds better product/market fit.
CAC and LTV
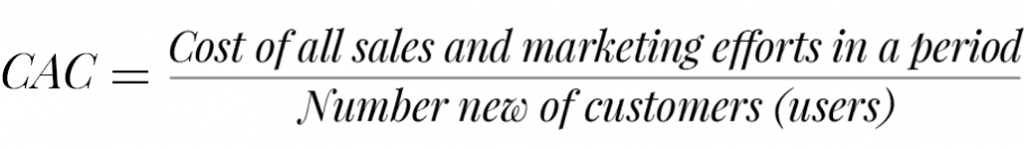
CAC—Customer Acquisition Cost:
CAC is a measurement of the full cost of acquiring new users, viewed as an average per user. All costs associated with gaining users should be considered, including the full employee burden of all sales and marketing staff over the period, all costs associated with sales and marketing efforts, and all advertisement costs.
LTV also known as CLV—Customer Lifetime Value:
LTV gives founders insight into how long a customer will use their product, and the average revenue that each user can be expected to provide.
Calculating LTV requires a knowledge of the ARPU (Average Revenue Per User):
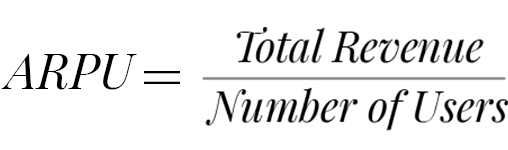
You are then ready to calculate LTV:

Rule of Thumb: CLV should be at minimum 3x CAC.
MRR
MRR—Monthly Recurring Revenue:
MRR is a measurement of revenue growth for a company, typically observed as a monthly average. It is important to note this does not necessarily reflect actual or realized revenue, therefore it is not accepted by GAAP, or Generally Accepted Accounting Principles. Instead it is a way to benchmark for analysis, forecast growth, and plan for future employment and investment.
Growth can be measured in MRR as it increases or decreases over time. This encompasses both revenue and user growth and retention.
For any given period of time, recurring revenue is equal to all revenue from recurring subscriptions and expansion MRR (upgrades from pre-existing user accounts) less churn:
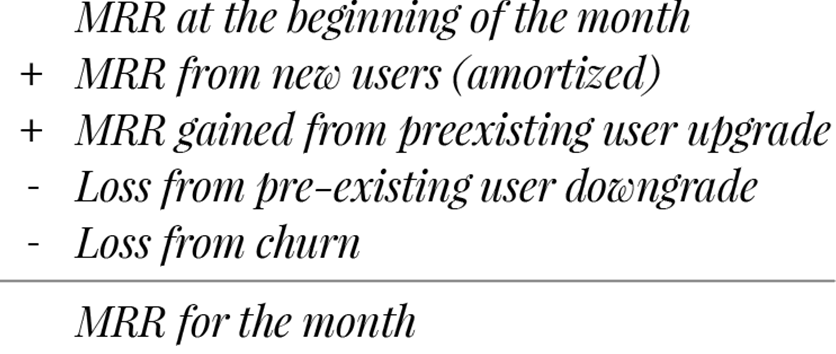
It is important to amortize (break down huge payments into the pariod they are utilized) any annual payments before they are added to MRR.
Therefore, if a user purchases a $1,200 annual subscription, this number should be divided by 12 to account for $100 monthly revenue from this user. Also, no one-time payments or fees are to be included in this number and discounts are to be accounted for.
MRR is a simple number that gives potential investors a snapshot of a company’s cash flow and some idea of the management abilities of its founders.
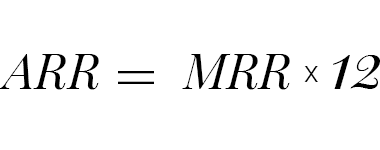
As this is viewed in averages, ARR is simply a more long term view of growth for companies with the timespan to support it (i.e. several years of data to examine). It is effectively MRR multiplied by 12.
Rule of thumb: the changes in MRR are a rate of growth, for this reason it is difficult to pinpoint a number that should work for all companies. That said, there is one general term you may run into:the rule of 40%, which states that a company’s growth rate plus its profit should add up to 40%. This rule allows for pre-profit companies to measure their growth and judge whether or not it’s hitting healthy levels.
Conversion Rate
Conversion rate— Conversion is the rate of customers that move to a given point along the sales funnel. Conversion rate is less often mentioned in KPI lists, as it is not measured from numbers listed on financial sheets. However, understanding this metric is invaluable to founders iterating their sales and marketing plans.
Understanding the change in user behavior and rate of movement through the funnel helps founders optimize sales and marketing efforts by finding bottlenecks and testing what causes a lower or higher drop off at each stage of the funnel.
Conversion rate can be calculated for any one of several conversion points. For example, a SaaS company might set up a funnel with the following points:

For the sake of simplicity, this can be found by:
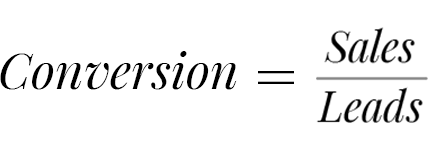
The above rate will show how many paying customers there are in a given set of leads, where a lead can be a cold lead, a contact discovered through a landing page, a demo user, etc.
Rule of thumb: There is no generally held rule of thumb for conversion rates. Analysis of conversion rates allows sales and marketing staff to focus on the source with the lowest CAC and length of sales cycle for each given source of potential clients.
Wrapping Up
Continuous monitoring of these KPIs will allow founders to better plan, understand, and react to changes in growth and revenue – and prepare to present to investors. Unsure of how to actually take this next step of searching for capital? Check out our pitch deck templates to get started, and stay tuned for our next installment on the funding process.
Written by
 How to Build Your Magic Machine: A primer on technical development for Startup Founders
  Net Neutrality in the Southeast: Why Emerging Hubs Should Fight for Title II